
Recommendation Algorithms: A Sneakpeak Using Spotify's API
Exploring the Python API

Imagine you are driving home, the sun is setting, the sky is full of colors, and youre jamming out to some of your favorite tunes. As one song fades out another song begins, but you’ve never heard this one before. Your playlist ended and Spotify “randomly” began to play a song. It turns out that you love this song and discover a new favorite artist. This is what Spotify specializes in, their recommendation algorithm is one of the best in the industry.
The way that recommendation algorithms are able to discover who I am, what I like, and what I am looking for has always amazed me. It’s a little bit unsettling how accurate they can be but nonetheless I enjoy them. By diving deep into the data set that I previously extracted using the spotfy API (see previous blog post down below), we are able to uncover a small portion of how Spotifies recommendation algorithms work.
Each song on Spotify has what is called “audio features”. These audio features are ways that they have found to meausure quantitatively what makes a song unique! For the sake of understanding the data visuals down below, I will include the defintions and explanations for just a few of Spotify’s audio features, even though many are self explanatory. Here is where I found the following info, Spotify for Developers.
Variables
Danceability: “How suitable a track is for dancing based on a combination of musical elements including tempo, rhythm stability, beat strength, and overall regularity. A value of 0.0 is least danceable and 1.0 is most danceable.”
Energy: “A measure from 0.0 to 1.0 and represents a perceptual measure of intensity and activity. Typically, energetic tracks feel fast, loud, and noisy.”
Loudness: “The overall loudness of a track in decibels (dB). Loudness values are averaged across the entire track and are useful for comparing relative loudness of tracks. Loudness is the quality of a sound that is the primary psychological correlate of physical strength (amplitude). Values typically range between -60 and 0 db.”
Speechiness: “Speechiness detects the presence of spoken words in a track. The more exclusively speech-like the recording (e.g. talk show, audio book, poetry), the closer to 1.0 the attribute value. Values above 0.66 describe tracks that are probably made entirely of spoken words. Values between 0.33 and 0.66 describe tracks that may contain both music and speech, either in sections or layered, including such cases as rap music. Values below 0.33 most likely represent music and other non-speech-like tracks.”
Instrumentalness: “Predicts whether a track contains no vocals. The closer the instrumentalness value is to 1.0, the greater likelihood the track contains no vocal content. Values above 0.5 are intended to represent instrumental tracks, but confidence is higher as the value approaches 1.0.”
Liveness: “Detects the presence of an audience in the recording. Higher liveness values represent an increased probability that the track was performed live. A value above 0.8 provides strong likelihood that the track is live.”
Valence: “A measure from 0.0 to 1.0 describing the musical positiveness conveyed by a track. Tracks with high valence sound more positive (e.g. happy, cheerful, euphoric), while tracks with low valence sound more negative (e.g. sad, depressed, angry).”
Tempo: “The overall estimated tempo of a track in beats per minute (BPM). In musical terminology, tempo is the speed or pace of a given piece and derives directly from the average beat duration.”
Popularity: A value calculated using the frequency of listens in comparisons to other songs from 0 - 100.
Duration: Length of track in seconds.
What trends do unique Spotify variables have over the last 50 years?
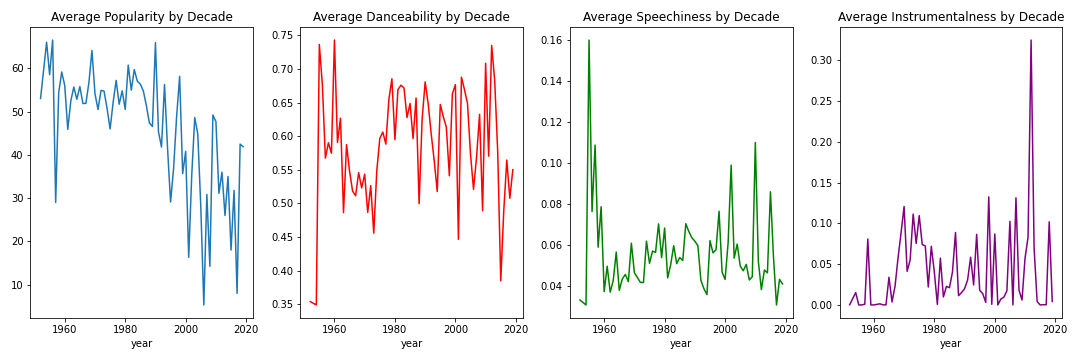
This figure aims to see basic trends of various unqiue variables over the last 50 years. We look at the variables: popularity, danceability, speechiness, and instrumentalness. Each figure shows the calculated average for each decade and puts it on a lineplot. You can see that many of the older songs on this playlist that have achieved “greatest songs ever” levels are much more popular than the newer songs. You can also see that the average danceability levels remained about the same. Speechiness had a lot of variety but most songs didn’t have much talking in them anywyas. Instrumentalness sees a huge spike in the 2000’s then returns back to normal.
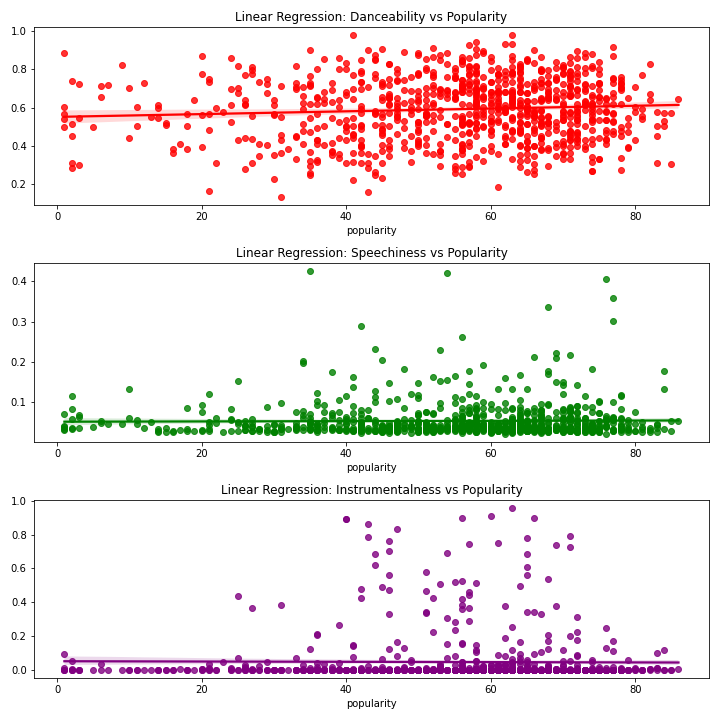
Can linear regression help us see correlation between certain variables? In this figure I decided to examine danceability, speechiness, and instrumentalness and their correlation with popularity. In a very uninteresting turn of events, speechiness and instrumentalness had almost zero effect on the popularity of the song. However, there is slight correlation between danceability and popularity, as danceability increased, so did popularity. But, only slightly.
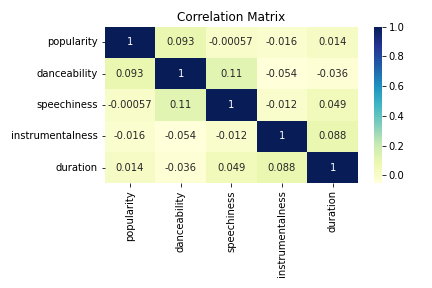
Is there correlation between other variables? Following the thought process in the previous section, I chose to to use a heatmap to see if there was any correlation among the variables. Again, this was rather uneventful and disappointing. There was almost no correlation between any of the variables. Nothing of significance. The closer the value to 1 the better, but in this case our highest number was only 0.11.
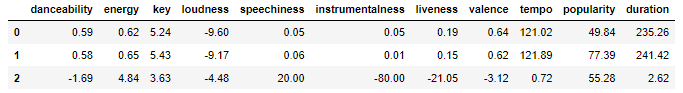
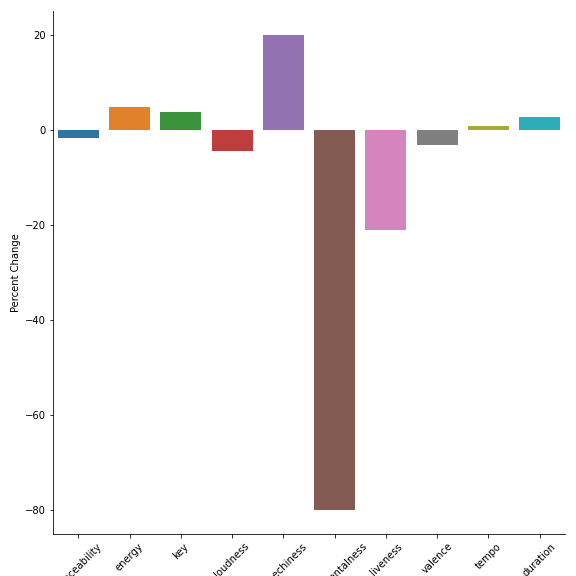
How do the variable averages change for the top 10 songs? I wondered if the lack of correlation was due to the imperfect playlist. There were many “greatest hits” on this list that had a popularity of zero. I thought it could be relevant to see if variable averages of the top 10 songs was different from the dataset averages! The first row of the table is the full data set, the second row is the top 10 songs, and the bottom row is the percent change between the first two rows!
This chart helps visualize the findings from the upper table! It graphs the percentage change for each variable! As we can see, instrumentalness had a very large change. Meaning the most popular songs were more likely to contain vocals. This may be an outlier but could be an interesting finding. Songs in the top 10 were less likely to be live recordings. However, we can see that songs in the top 10 were more likely to contain speaking lines!
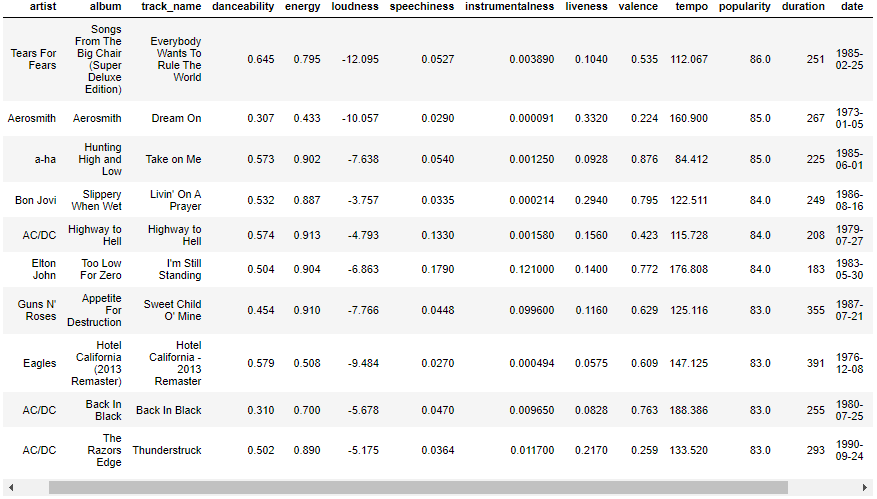
What are the top 10 most popular songs in this dataset? It is always intersting to see the actual songs behind the data, this table displays the top 1o songs with the highest popularity values in our dataset.
In Conclusion
Understanding the Spotify recommendation algorithms is diffiuclt and complicated but by looking deeper into the dataset and using visauls I was able to gain a better understanding of how it works. I also have a deeper desire to learn more about how machine learning algorithms work, this dataset only contains a fraction of the variables that go into recommending songs to listeners!
Thank you for reading my blog post! I hope that it was an informative and informational experience!
If you would like to see my code and final dataset, here is my Git Hub Repo.
Previous Blog Post ———————————————————————————————————————————–
Have you ever wondered how Spotify has achieved it’s success? I know I have, and by accessing their API, I was able to gain a deeper understanding of the music streaming giant. Through gathering an incredible amount of data on each of the 80 million songs on their platform, Spotify is able to using data science and machine learning to understand their users. Spotify can use paramaters such as danceability, energy, speechiness, instrumentalness, and many others to understand why you listen to the music you do. Among many things, this data collection and analysis allows them to recommend music to you that is likely to keep you listening. Keep reading to learn how to access the Spotify API using the Python package Spotipy.
Accessing the API
In 2014 Spotify made their metadata about artists, albums, playlists, and songs publicly available for anyone to access. One of the reasons they did this was so that external developers could access this data and write programs for apps, smart home gadgets, and anything linked to Spotify. The provide easy documentation of how to access their API on this [Website](https://developer.spotify.com/documentation/web-api/_.
In order to access their API you need register with Spotify. This requires you to go to https://developer.spotify.com/dashboard/login. After logging in you need to navigate to the page with the information of your “Client ID” and “Client Secret ID”. All of the next steps can be done in python.
The package “spotipy” was a package created to allow to explore the metadata in Python. Make sure that you have installed it before you start!
This step is unique to Spotify. The cid and secret(id) must be entered in order to give you access to their API. I have replaced mine with “x”’s but you get the idea.
cid = 'xxxxxxxxxxxxxxxxxxxxxxxxxxxxxxxx'
secret = 'xxxxxxxxxxxxxxxxxxxxxxxxxxxxxxxx'
client_credentials_manager = SpotifyClientCredentials(client_id= cid, client_secret= secret)
sp = spotipy.Spotify(client_credentials_manager = client_credentials_manager)
After doing this, you are ready to explore Spotify’s expansive metadata.
In our case, we are going to be selecting a specfic playlist and grabbing all the data for each specific track. After choosing a playlist, copy the end of the URL and the username that created the playlist.
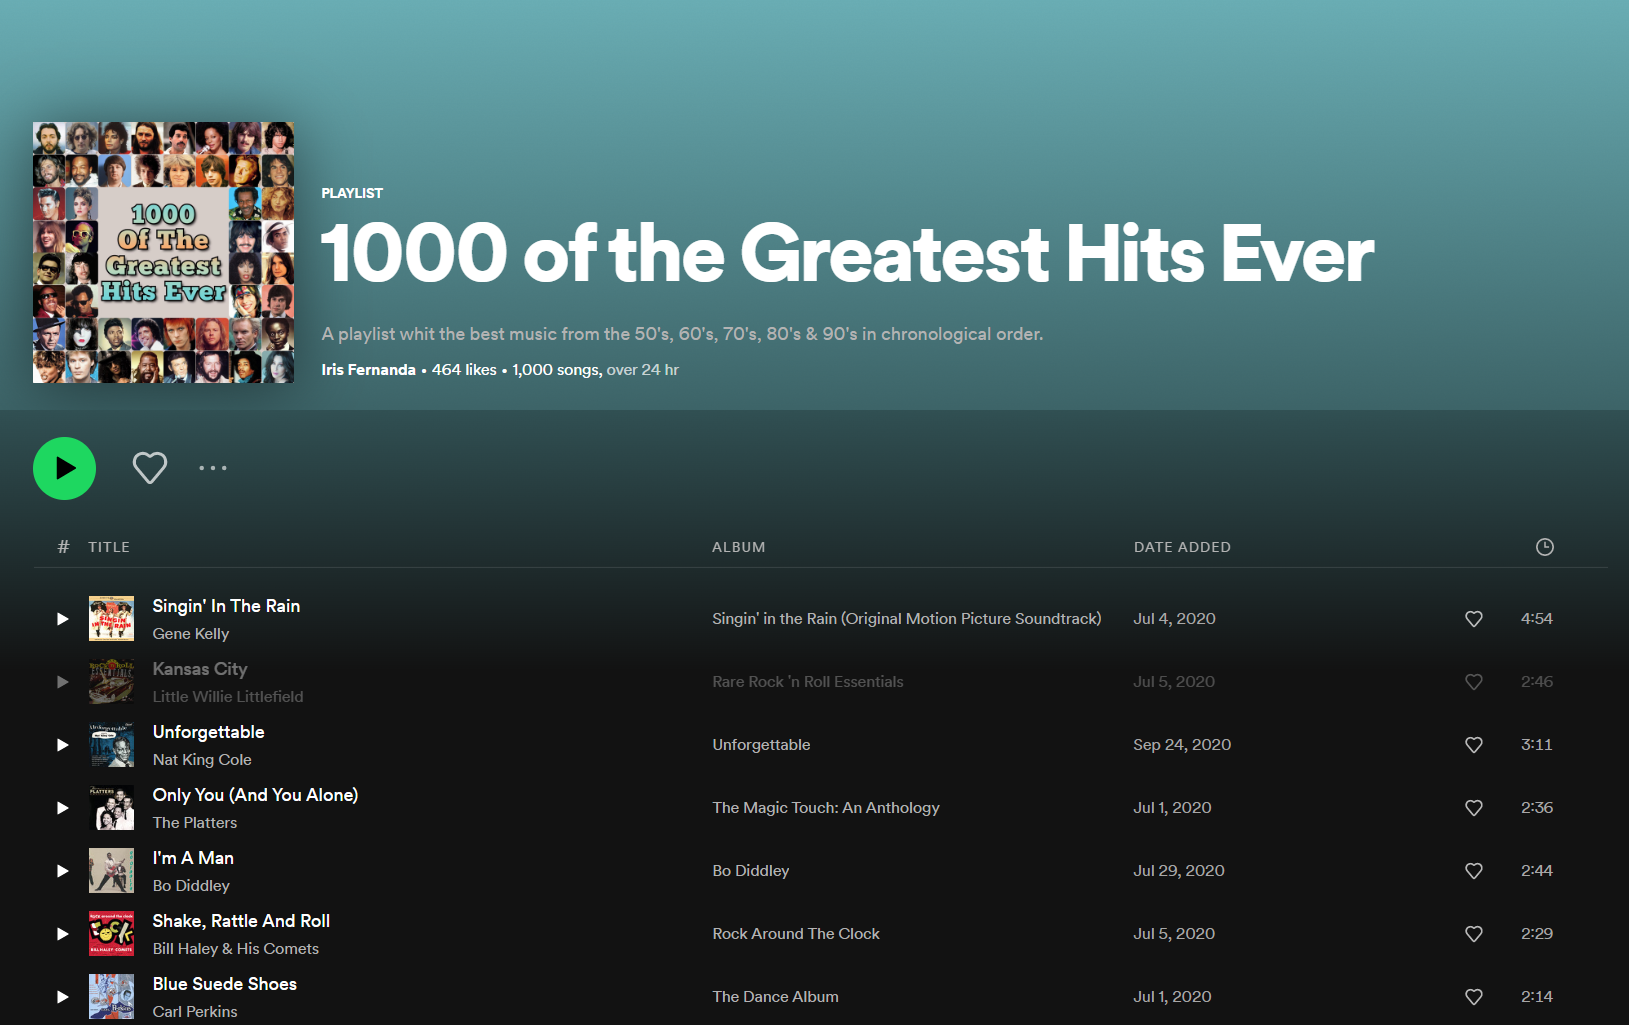
I chose to grab a playlist titled “1000 of the greatest hits ever”, created by “Iris Fernanda”
# 1000 of the greatest hits ever: Iris Fernanda 0hKruppKCtqPcSYgnCCVBg
In order to collect the information I was looking for I had to create two functions.
The first function would was created to collect the entire playlist. I was running into a problem that prevented me from pulling more than 100 songs at once, and this function allowed me to get past that and collect all 1000 songs. This function was then called in the second function.
Included below is some of the code from the function get_songs. This code would loop through each song and extract it’s features adding them to a dataframe.
playlist = get_playlist_tracks(username, playlist_id)

for track in playlist:
   # Create dictionary
   playlist_features = {}
   # Get metadata
   playlist_features["artist"] = track["track"]["album"]["artists"][0]["name"]
   playlist_features["album"] = track["track"]["album"]["name"]
   playlist_features["track_name"] = track["track"]["name"]
   playlist_features["track_id"] = track["track"]["id"]

   # Get audio features
   audio_features = sp.audio_features(playlist_features["track_id"])[0]
   for feature in playlist_features_list[4:]:
       playlist_features[feature] = audio_features[feature]
Conclusion
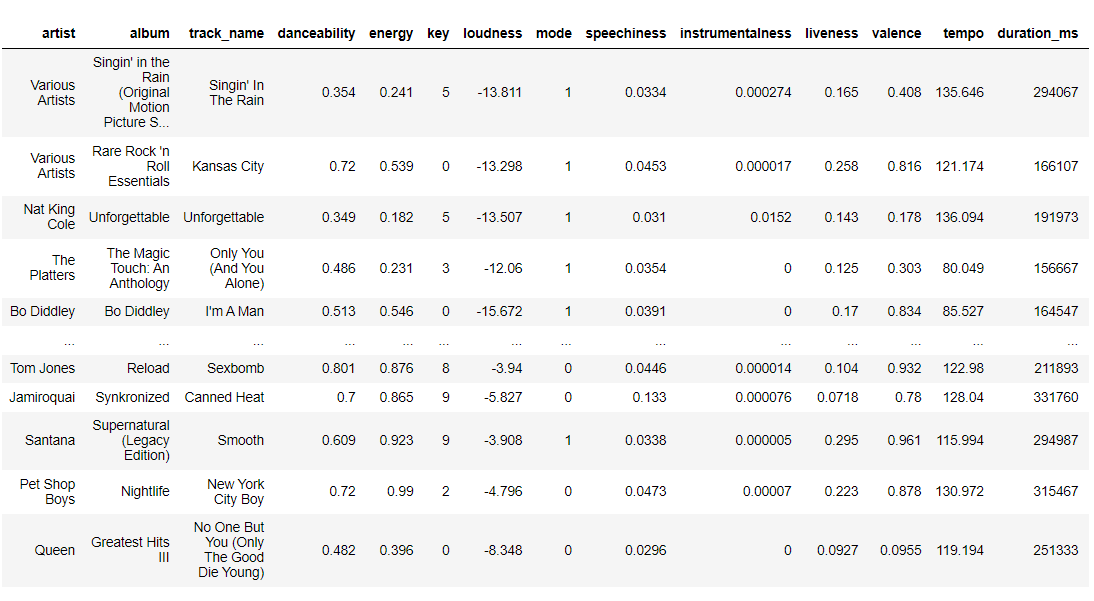
This is the resulting dataframe after calling the function. It includes basic information about each song including unique measurements that Spotify has created such as: danceability, loudness, speechiness, and insturmentalness.
I really enjoyed learning how to scrape data from the Spotify API. It gave me a behind the scenes look into the workings of the Spotify’s algorithms and company. In my next post I will be doing an exploratory data analysis of this dataframe to answer questions such as: What makes a song a greatest hit? Does danceability have a greater effect than speechiness? What are the key indicators to a greatest hit?
If you would like to see my code and final dataset, here is a Git Hub Repo.